A Supporting Information for “Mapping-Friendly Sequence Reductions: Going Beyond Homopolymer Compression”
A.1 “TandemTools” dataset generation
This dataset was obtained by taking a human X chromosome HOR sequence, concatenating it 500 times with added mutations in order to obtain an approximately 1 Mbp long sequence. Then 1200 reads were simulated from the sequence using nanosim318 and assembled using a centromere-tailored pipeline743. A 10kbp deletion was then added to this assembly. The resulting sequence is the one we refer to as the “Centromeric sequence”.
A.2 MSR performance comparison
label | mapq = 60 | mapq ≥ 50 | any mapq | |||
fraction | error | fraction | error | fraction | error | |
Whole Drosophila melanogaster genome - minimap (n=25764) | ||||||
HPC | 0.957 +0% | 2.27e-03 +0% | 0.963 +0% | 2.34e-03 +0% | 0.998 +0% | 1.48e-02 +0% |
raw | 0.958 +0% | 2.27e-03 -0% | 0.962 -0% | 2.34e-03 +0% | 0.997 -0% | 1.17e-02 -21% |
MSRF | 0.952 -1% | 1.18e-03 -48% | 0.960 -0% | 1.37e-03 -41% | 0.998 +0% | 1.36e-02 -8% |
MSRE | 0.946 -1% | 0 -100% | 0.954 -1% | 0 -100% | 0.998 +0% | 1.53e-02 +3% |
MSRP | 0.950 -1% | 4.90e-04 -78% | 0.957 -1% | 8.11e-04 -65% | 0.998 -0% | 1.39e-02 -6% |
Whole Drosophila melanogaster genome - winnowmap (n=25764) | ||||||
HPC | 0.923 +0% | 1.51e-03 +0% | 0.930 +0% | 1.59e-03 +0% | 0.989 +0% | 1.50e-02 +0% |
raw | 0.949 +3% | 1.92e-03 +27% | 0.954 +3% | 1.99e-03 +26% | 0.995 +1% | 1.33e-02 -12% |
MSRF | 0.918 -1% | 1.27e-03 -16% | 0.925 -0% | 1.30e-03 -18% | 0.987 -0% | 1.37e-02 -9% |
MSRP | 0.905 -2% | 1.33e-03 -12% | 0.912 -2% | 1.53e-03 -3% | 0.983 -1% | 1.40e-02 -7% |
MSRE | 0.905 -2% | 1.42e-03 -6% | 0.912 -2% | 1.49e-03 -6% | 0.983 -1% | 1.44e-02 -4% |
Synthetic centromeric sequence - minimap (n=12673) | ||||||
HPC | 0.870 +0% | 1.36e-03 +0% | 0.964 +0% | 1.56e-03 +0% | 1.000 +0% | 9.00e-03 +0% |
raw | 0.936 +8% | 1.86e-03 +36% | 0.984 +2% | 2.09e-03 +34% | 1.000 +0% | 4.50e-03 -50% |
MSRE | 0.885 +2% | 3.39e-03 +149% | 0.962 -0% | 3.53e-03 +127% | 1.000 +0% | 1.20e-02 +33% |
MSRF | 0.850 -2% | 2.04e-03 +50% | 0.968 +0% | 2.12e-03 +36% | 1.000 +0% | 6.63e-03 -26% |
MSRP | 0.898 +3% | 1.58e-03 +16% | 0.968 +0% | 1.79e-03 +15% | 1.000 +0% | 9.78e-03 +9% |
Synthetic centromeric sequence - winnowmap (n=12673) | ||||||
HPC | 0.775 +0% | 1.32e-03 +0% | 0.822 +0% | 1.82e-03 +0% | 0.997 +0% | 8.37e-02 +0% |
raw | 0.850 +10% | 2.04e-03 +54% | 0.890 +8% | 1.95e-03 +7% | 0.999 +0% | 4.60e-02 -45% |
MSRE | 0.795 +2% | 2.28e-03 +73% | 0.846 +3% | 2.52e-03 +38% | 0.997 -0% | 6.96e-02 -17% |
MSRF | 0.820 +6% | 1.83e-03 +38% | 0.867 +6% | 2.27e-03 +25% | 0.997 -0% | 5.97e-02 -29% |
MSRP | 0.780 +1% | 1.62e-03 +22% | 0.829 +1% | 2.09e-03 +15% | 0.997 -0% | 8.65e-02 +3% |
Whole human genome - minimap (n=655594) | ||||||
HPC | 0.935 +0% | 1.85e-03 +0% | 0.942 +0% | 1.85e-03 +0% | 1.000 +0% | 1.46e-02 +0% |
raw | 0.921 -1% | 1.86e-03 +0% | 0.927 -2% | 1.86e-03 +1% | 0.998 -0% | 1.29e-02 -11% |
MSRE | 0.926 -1% | 6.92e-05 -96% | 0.936 -1% | 1.17e-04 -94% | 0.999 -0% | 1.76e-02 +20% |
MSRP | 0.929 -1% | 2.20e-04 -88% | 0.938 -0% | 4.15e-04 -78% | 0.999 -0% | 1.55e-02 +6% |
MSRF | 0.930 -1% | 1.09e-03 -41% | 0.938 -0% | 1.29e-03 -30% | 1.000 -0% | 1.51e-02 +4% |
Whole human genome - winnowmap (n=655594) | ||||||
HPC | 0.894 +0% | 1.43e-03 +0% | 0.902 +0% | 1.49e-03 +0% | 0.988 +0% | 1.92e-02 +0% |
raw | 0.932 +4% | 1.75e-03 +23% | 0.937 +4% | 1.79e-03 +20% | 0.994 +1% | 1.43e-02 -26% |
MSRF | 0.874 -2% | 2.81e-04 -80% | 0.886 -2% | 3.82e-04 -74% | 0.984 -0% | 1.94e-02 +1% |
MSRE | 0.795 -11% | 6.33e-05 -96% | 0.820 -9% | 8.93e-05 -94% | 0.971 -2% | 2.08e-02 +9% |
MSRP | 0.826 -8% | 8.68e-05 -94% | 0.845 -6% | 1.14e-04 -92% | 0.975 -1% | 2.11e-02 +10% |
Whole Human genome (repeated regions) - minimap (n=68811) | ||||||
HPC | 0.619 +0% | 3.29e-04 +0% | 0.656 +0% | 3.10e-04 +0% | 0.998 +0% | 7.79e-02 +0% |
raw | 0.514 -17% | 1.98e-04 -40% | 0.539 -18% | 2.16e-04 -30% | 0.981 -2% | 6.69e-02 -14% |
MSRF | 0.601 -3% | 2.18e-04 -34% | 0.640 -2% | 2.27e-04 -27% | 0.998 -0% | 8.15e-02 +5% |
MSRE | 0.618 -0% | 1.41e-04 -57% | 0.658 +0% | 1.55e-04 -50% | 0.997 -0% | 8.23e-02 +6% |
MSRP | 0.616 -1% | 1.18e-04 -64% | 0.656 +0% | 1.99e-04 -36% | 0.997 -0% | 8.31e-02 +7% |
Whole Human genome (repeated regions) - winnowmap (n=68811) | ||||||
HPC | 0.525 +0% | 1.24e-03 +0% | 0.557 +0% | 1.49e-03 +0% | 0.950 +0% | 1.19e-01 +0% |
raw | 0.648 +23% | 1.26e-03 +1% | 0.672 +21% | 1.49e-03 +0% | 0.968 +2% | 8.09e-02 -32% |
MSRF | 0.482 -8% | 1.63e-03 +31% | 0.516 -7% | 1.83e-03 +23% | 0.940 -1% | 1.21e-01 +2% |
MSRE | 0.366 -30% | 6.35e-04 -49% | 0.405 -27% | 9.32e-04 -37% | 0.911 -4% | 1.38e-01 +17% |
MSRP | 0.415 -21% | 9.45e-04 -24% | 0.451 -19% | 1.16e-03 -22% | 0.920 -3% | 1.39e-01 +17% |
A.3 Analyzing read origin on whole human genome
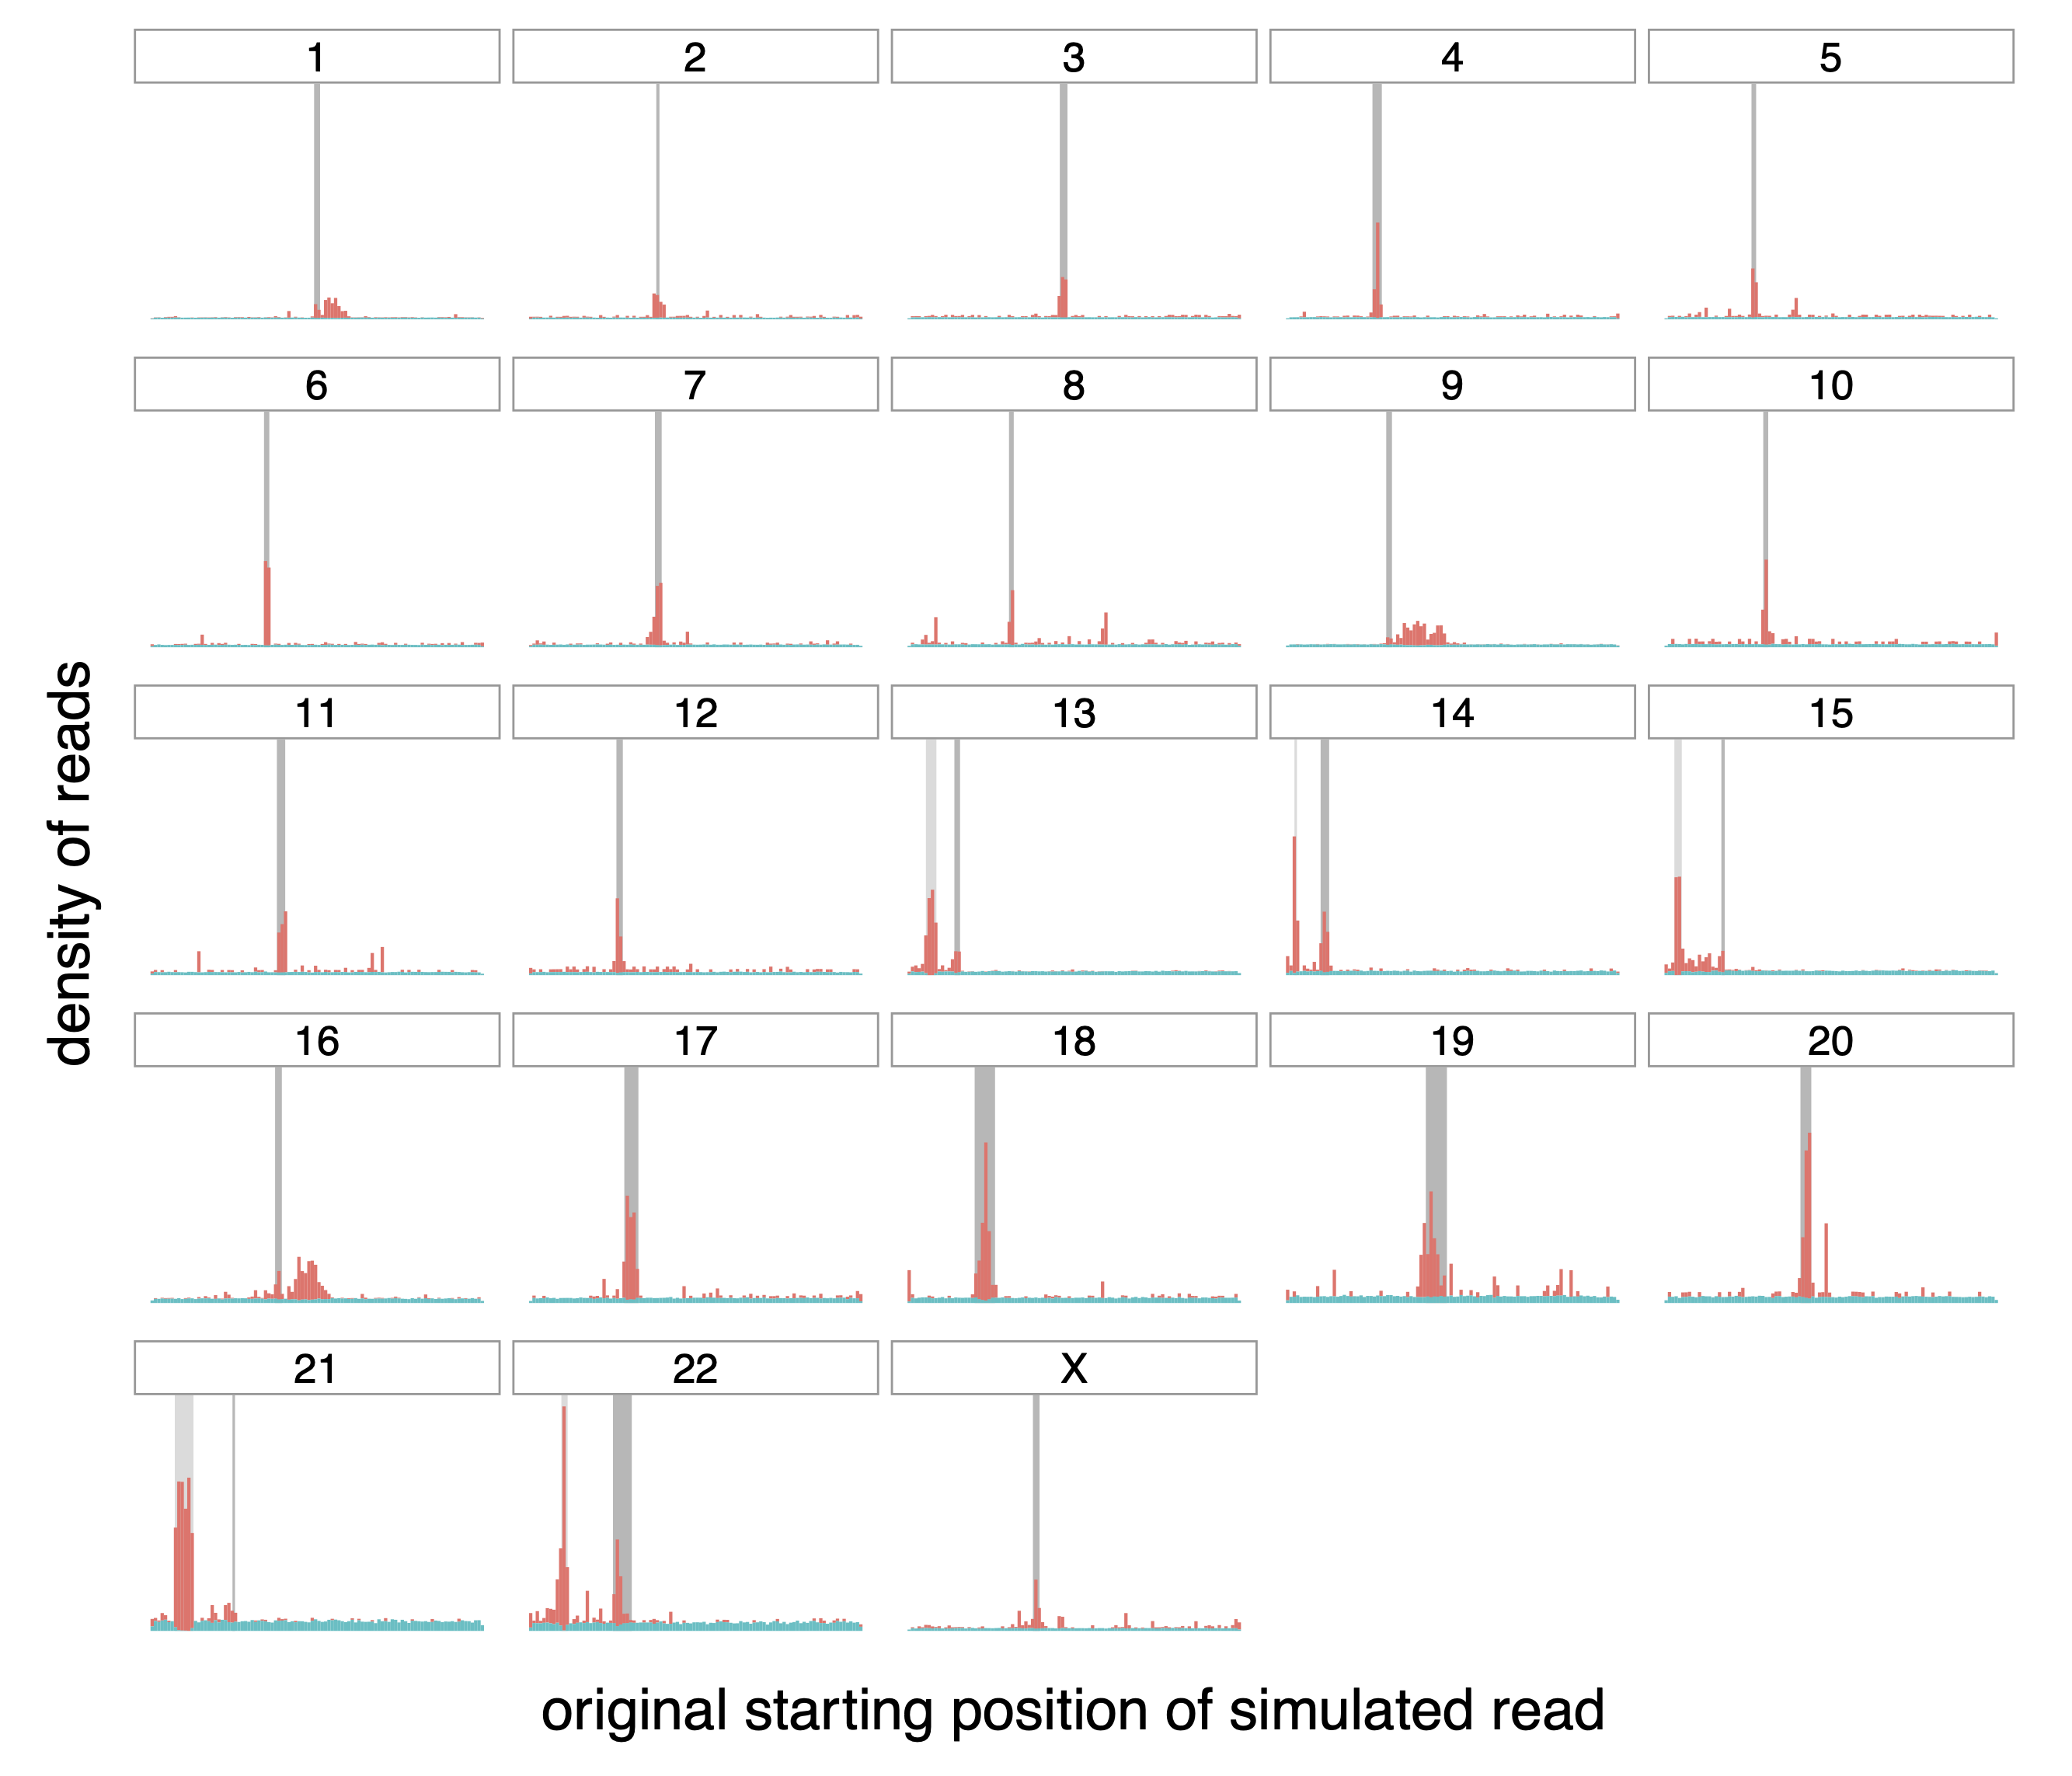
Figure A.1: Origin of correctly (teal) and incorrectly (red) mapped raw reads.
Distribution of the origin of correctly and incorrectly mapped simulated
reads (in teal and red respectively) on the different chromosomes of the
whole human genome. The dark grey rectangle for each chromosome
represents the centromere of that chromosome. The lighter gray rectangle
on chromosomes 13, 14, 15, 21 and 22 correspond to satellites denoted as
“stalk”, another repetitive region.
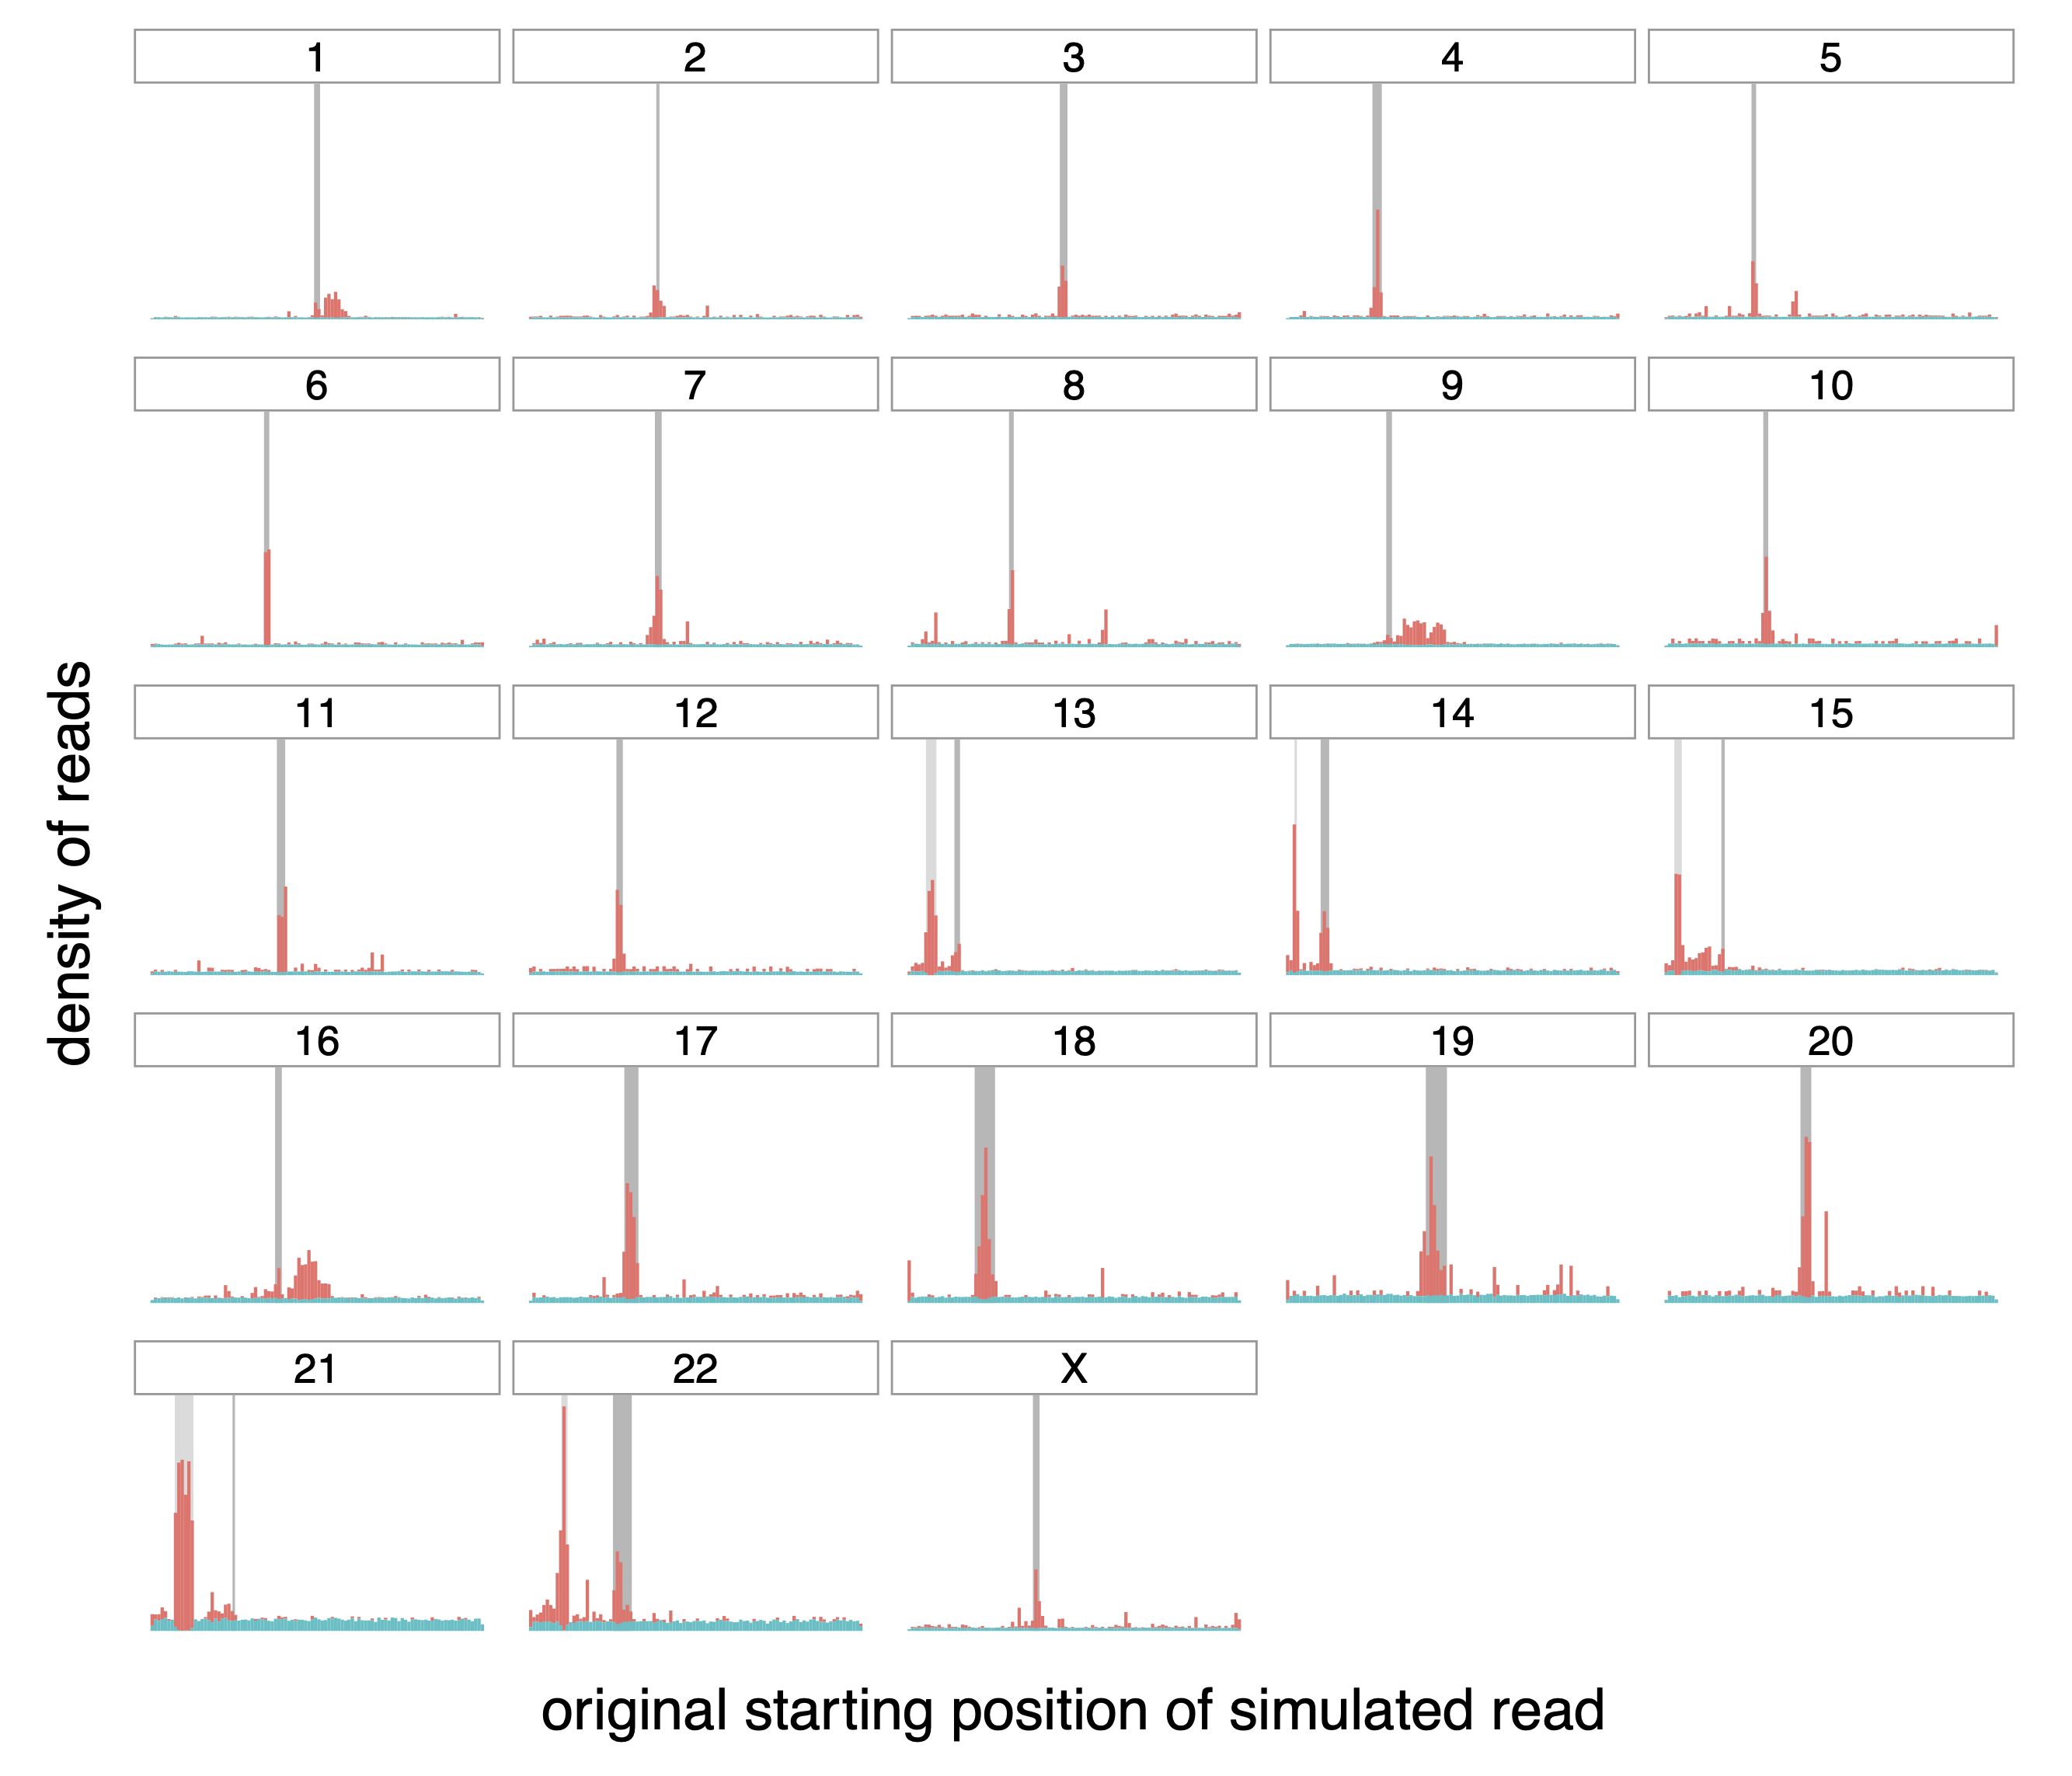
Figure A.2: Origin of correctly (teal) and incorrectly (red) mapped reads,
transformed with HPC.
Distribution of the origin of correctly and incorrectly mapped simulated
reads (in teal and red respectively) on the different chromosomes of the
whole human genome. The dark grey rectangle for each chromosome
represents the centromere of that chromosome. The lighter gray rectangle
on chromosomes 13, 14, 15, 21 and 22 correspond to satellites denoted as
“stalk”, another repetitive region.
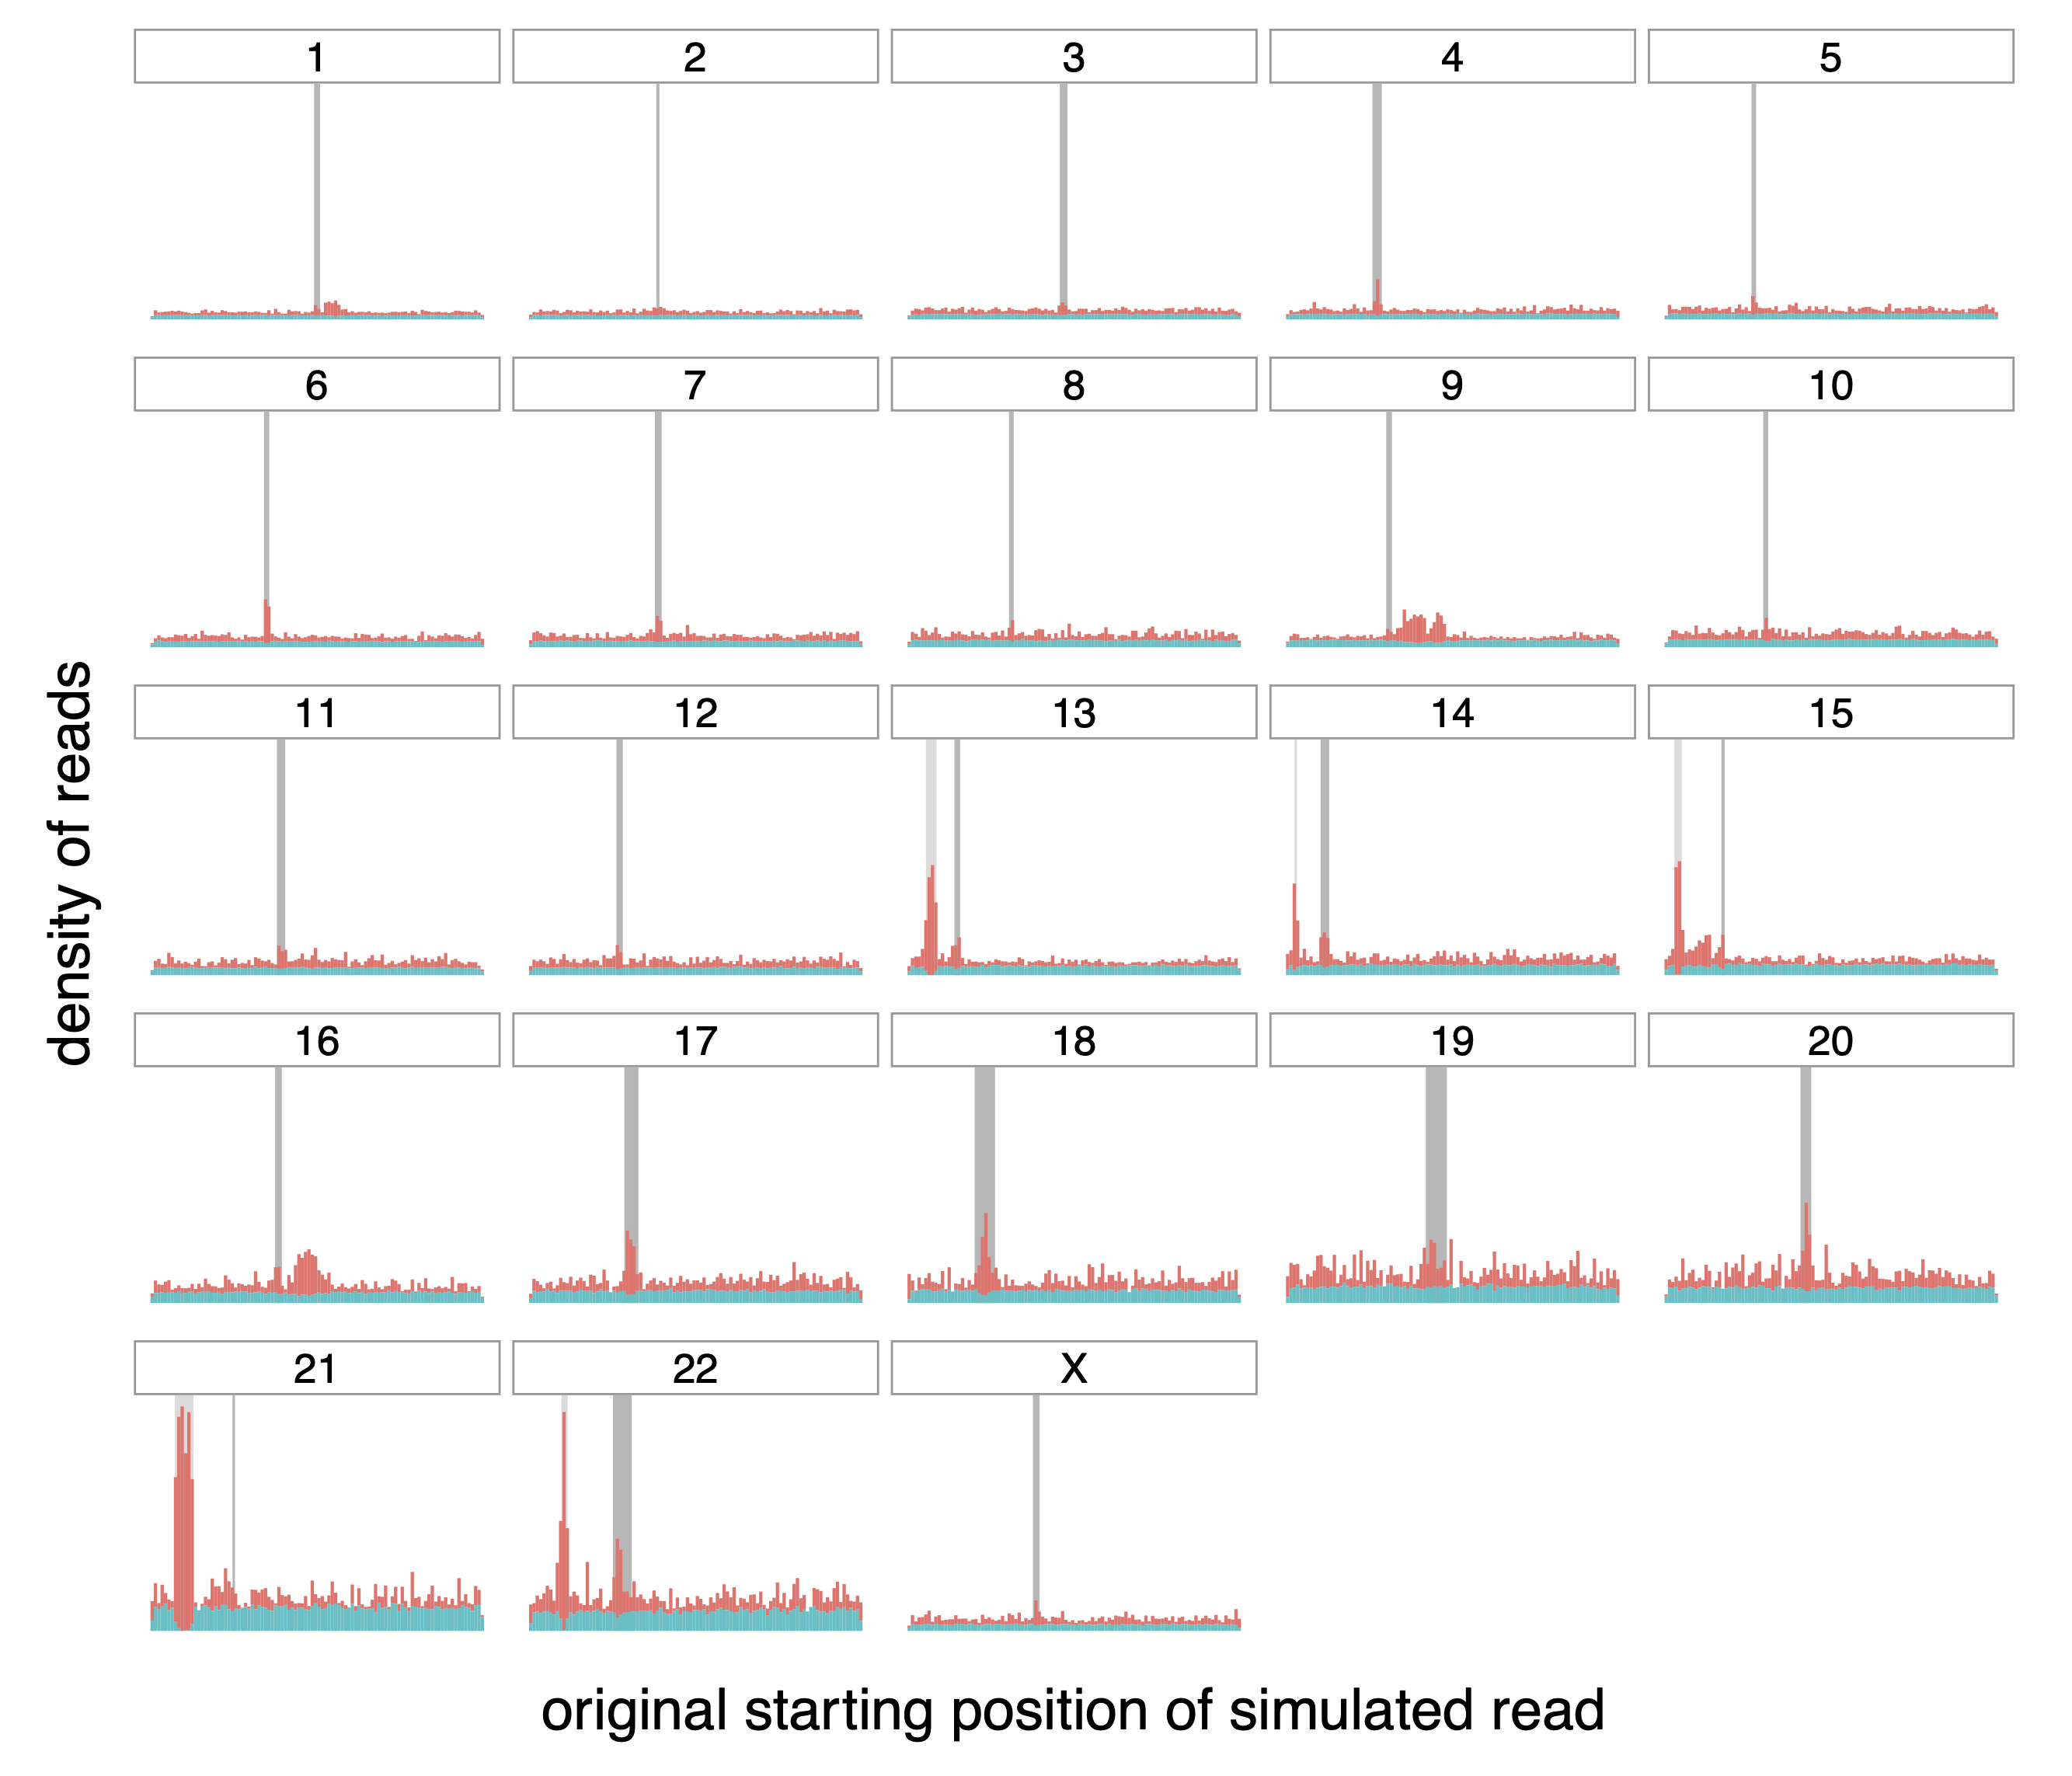
Figure A.3: Origin of correctly (teal) and incorrectly (red) mapped reads,
transformed with MSRE.
Distribution of the origin of correctly and incorrectly mapped simulated
reads (in teal and red respectively) on the different chromosomes of the
whole human genome. The dark grey rectangle for each chromosome
represents the centromere of that chromosome. The lighter gray rectangle
on chromosomes 13, 14, 15, 21 and 22 correspond to satellites denoted as
“stalk”, another repetitive region.
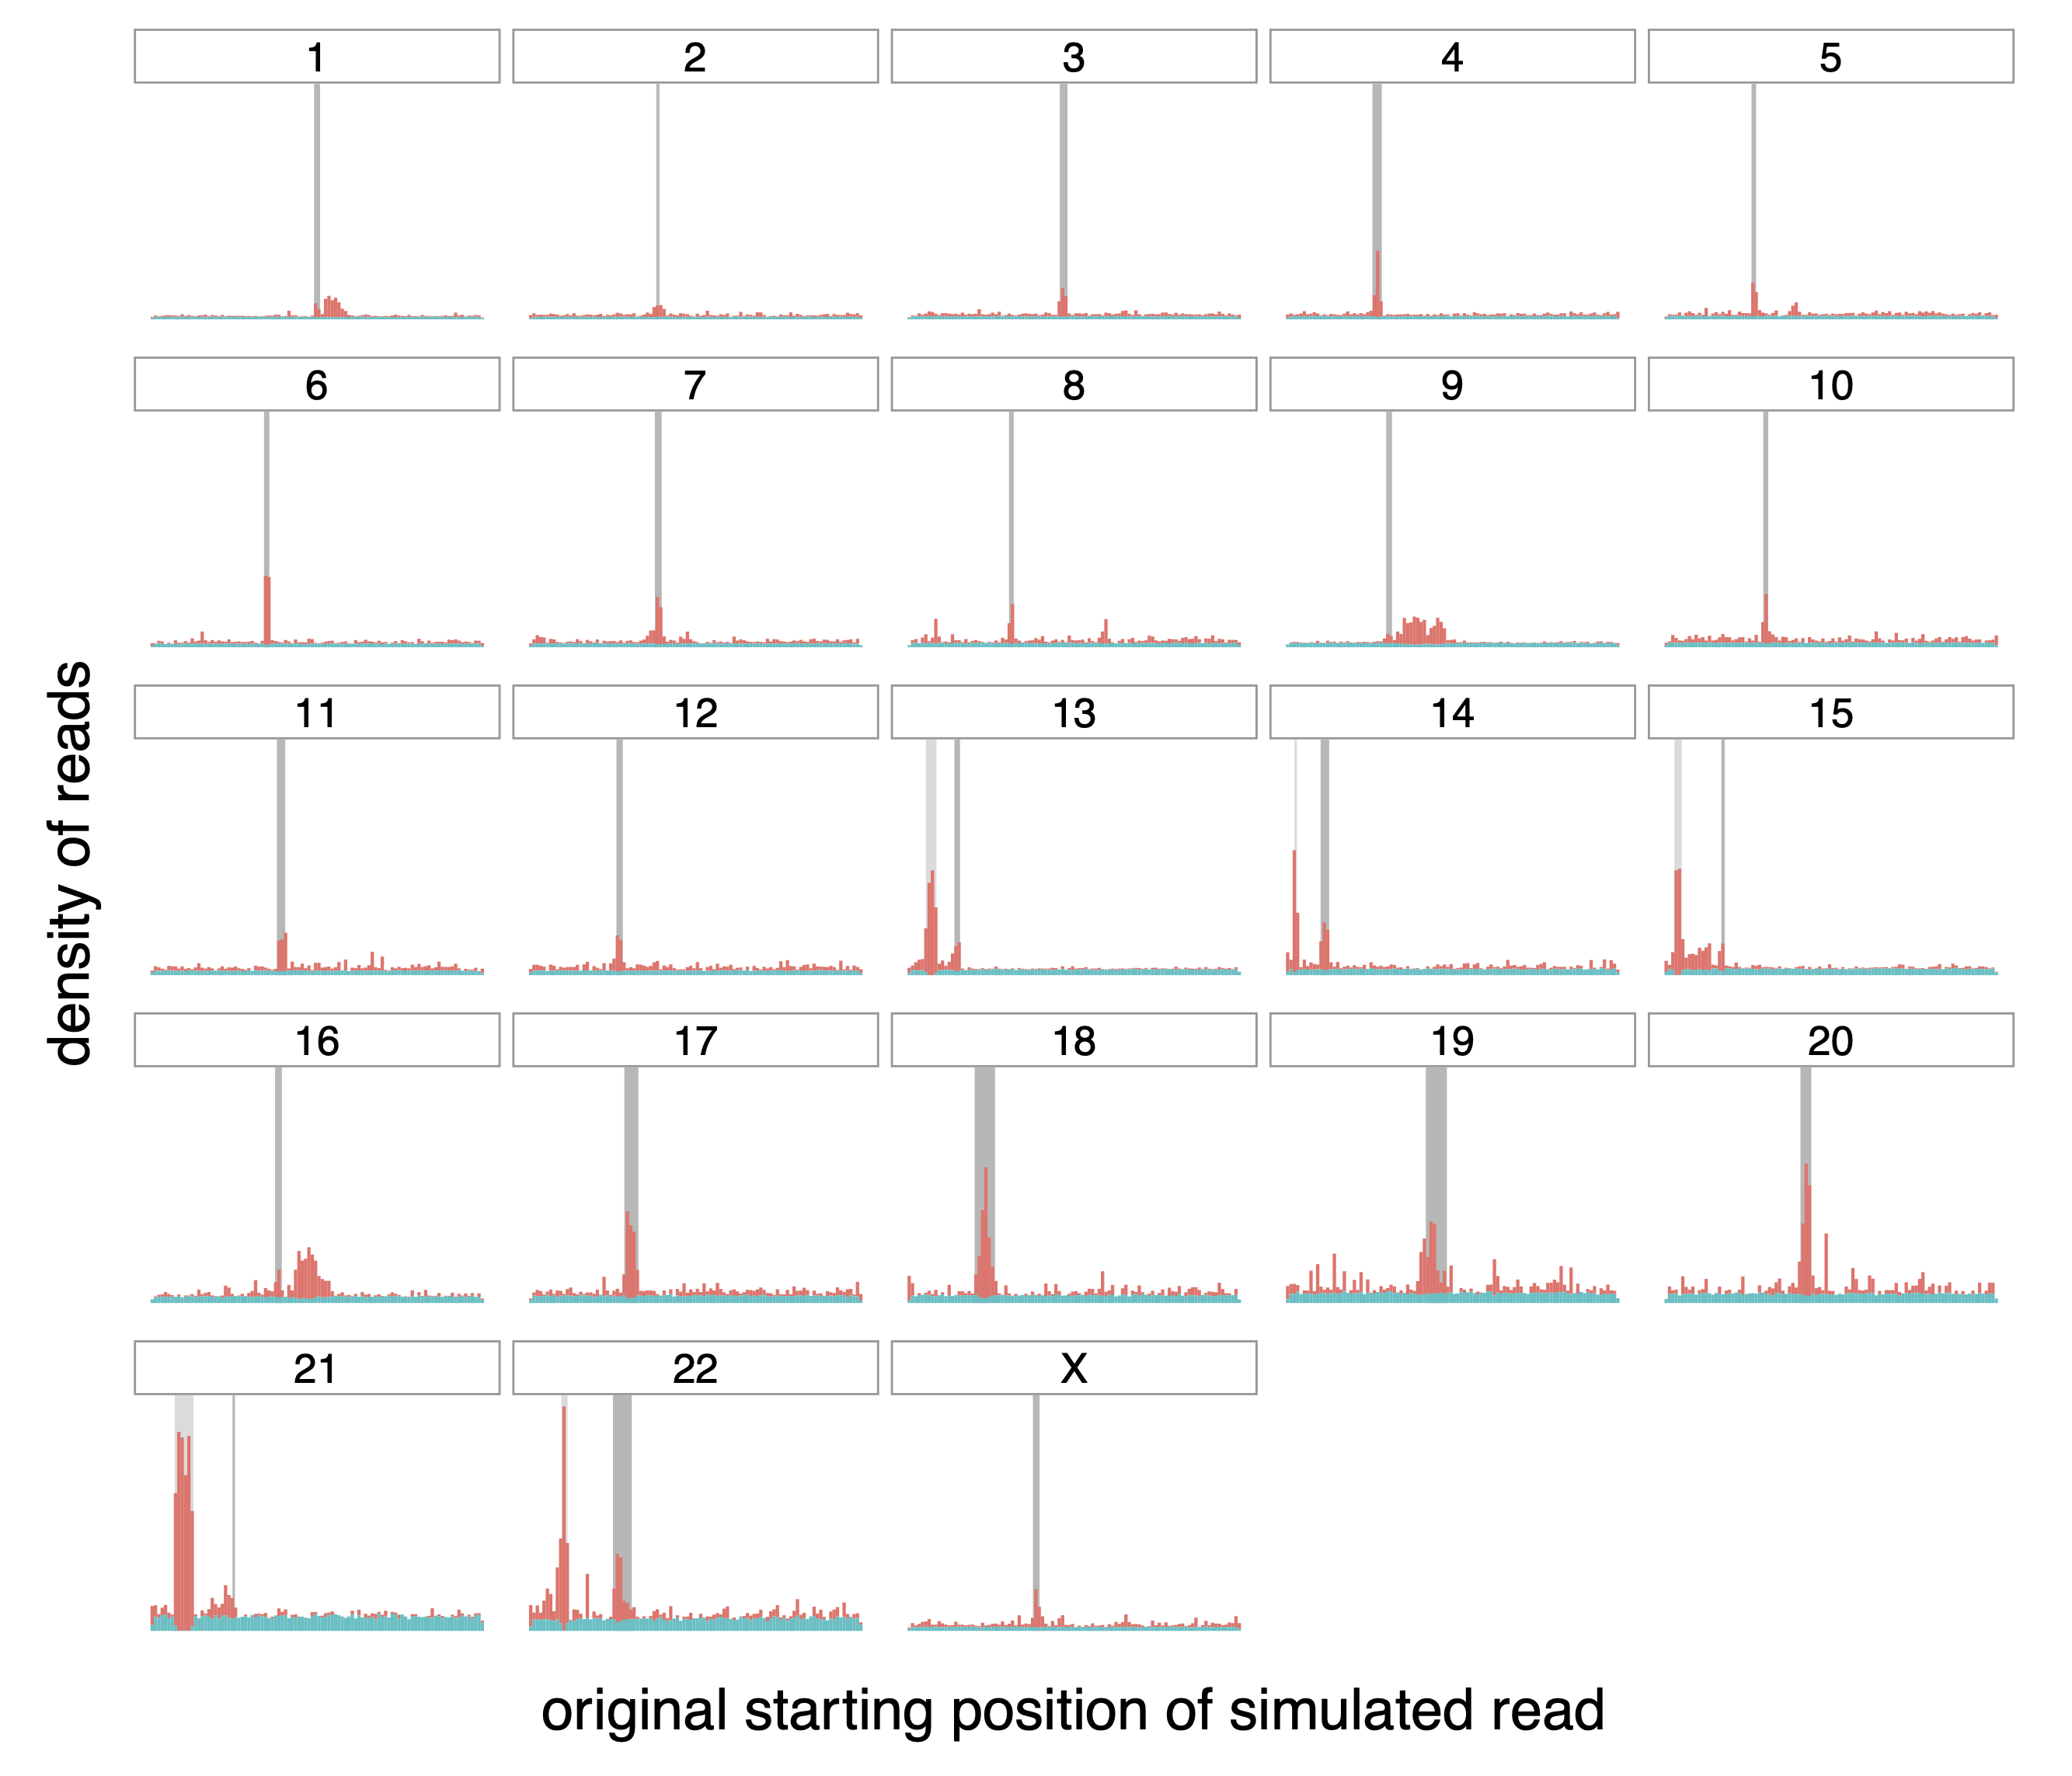
Figure A.4: Origin of correctly (teal) and incorrectly (red) mapped reads,
transformed with MSRP.
Distribution of the origin of correctly and incorrectly mapped simulated
reads (in teal and red respectively) on the different chromosomes of the
whole human genome. The dark grey rectangle for each chromosome
represents the centromere of that chromosome. The lighter gray rectangle
on chromosomes 13, 14, 15, 21 and 22 correspond to satellites denoted as
“stalk”, another repetitive region.

Figure A.5: Origin of correctly (teal) and incorrectly (red) mapped reads,
transformed with MSRF.
Distribution of the origin of correctly and incorrectly mapped simulated
reads (in teal and red respectively) on the different chromosomes of the
whole human genome. The dark grey rectangle for each chromosome
represents the centromere of that chromosome. The lighter gray rectangle
on chromosomes 13, 14, 15, 21 and 22 correspond to satellites denoted as
“stalk”, another repetitive region.
A.4 Performance of MSRs on the Drosophila genome
](figures/HPC-MSRs/droso_ecoli.png)
Figure A.6: Results of the paftools mapeval evaluation on reads simulated and
mapped to whole Drosophila melanogaster and Escherichia coli genomes.
MSRs E, F and P are shown in different shades of blue to
differentiate them from other MSRs. Reads were simulated with nanosim,
and mapped with minimap2. The E. coli genome was obtained from Genbank ID U00096.2
A.5 Key resource table
REAGENT or RESOURCE | SOURCE | IDENTIFIER |
Deposited Data | ||
T2T CHM13 v1.1, whole human genome assembly | (Nurk et al., 2022) | Genbank accession number GCA_009914755.3 |
Release 6 plus ISO1 MT, whole drosophila melanogaster genome assembly | (Adams et al., 2000) | Genbank accession number GCA_000001215.4 |
Synthetic centrormeric sequence | (Mikheenko et al., 2020) | https://github.com/ablab/TandemTools/blob/master/test_data/simulated_del.fasta |
Escherichia coli str. K-12 substr. MG1655, complete genome | (Blattner et al., 1997) | Genbank accession number U00096.2 |
Coordinates of repeated regions of the CHM13 whole genome assembly | Telomere to Telomere consortium | https://t2t.gi.ucsc.edu/chm13/hub/t2t-chm13-v1.1/rmsk/rmsk.bigBed |
Software and Algorithms | ||
minimap2 v2.22-r1101 | (Li, 2018) | |
Winnowmap v2.0 | (Jain et al., 2020) | |
NanoSim v3.0.0 | (Yang et al., 2017) | |
Bedtools v2.30.0 | (Quinlan et al., 2010) | |
Meryl v1.0 | (Rhie et al., 2020) | |
Analysis pipelines | This paper | |